Live pipeline output
Sample Report — Texas
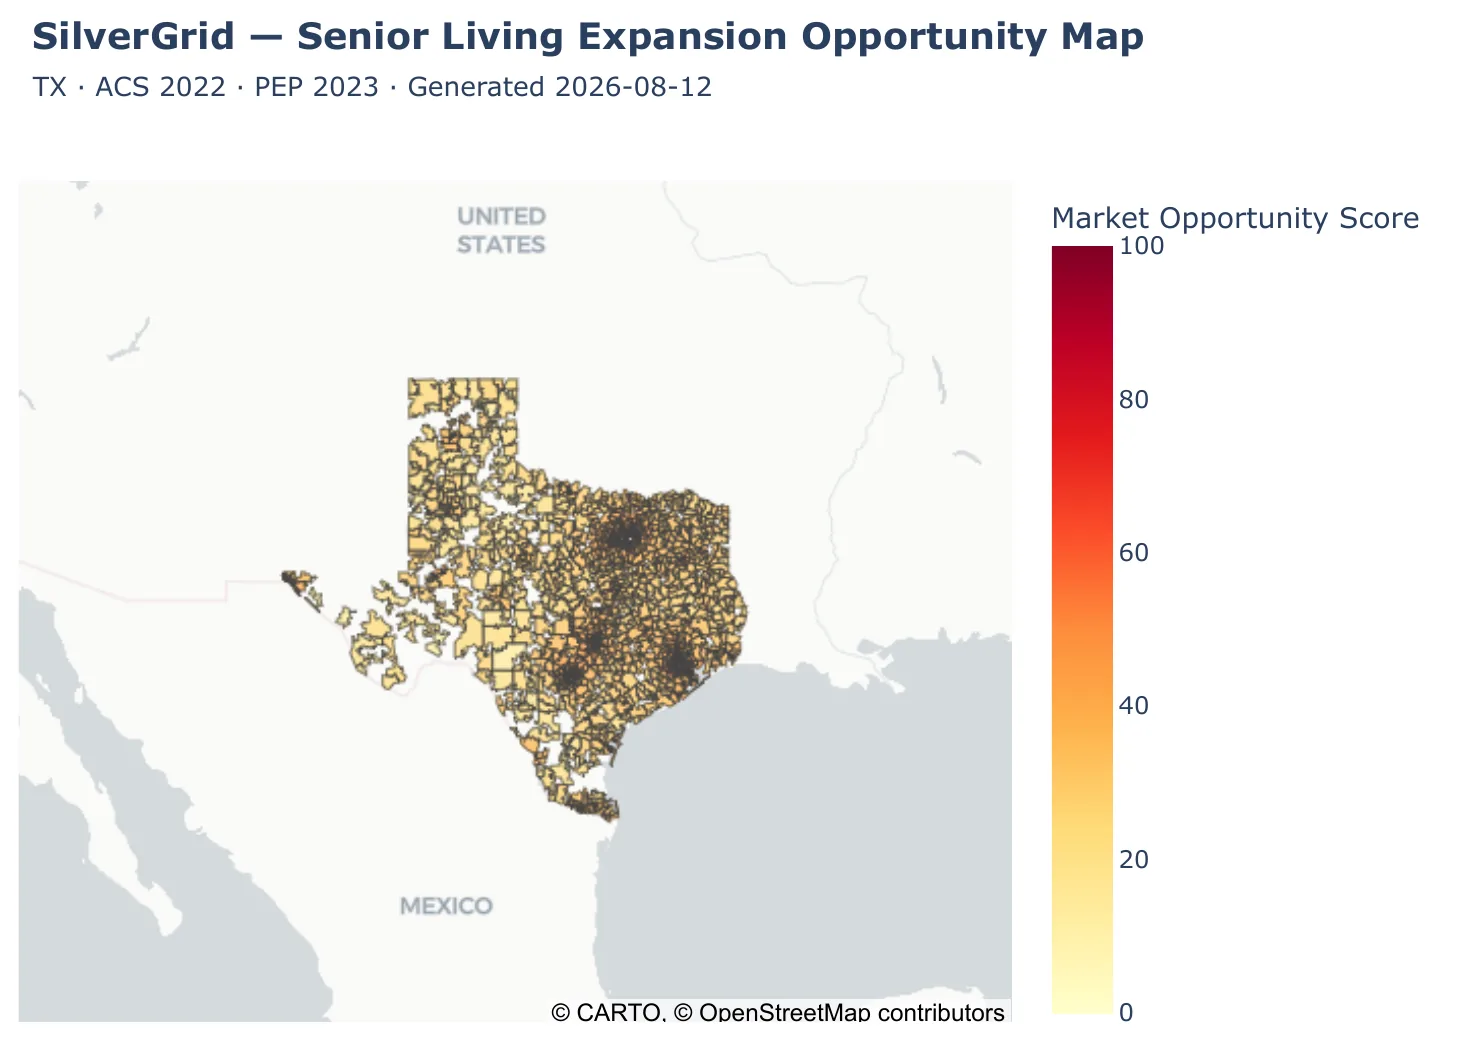
SilverGrid — Senior Living Expansion Opportunity Map · TX · ACS 2022 · PEP 2023
This is a real, unedited scope run from the SilverGrid pipeline — not a mockup.
Ranked output
Top Opportunity ZIPs
| 77005 | Houston (West University Place) | 65.6 | Silver | 6,003 |
| 75205 | Dallas (Highland Park) | 64.2 | Silver | 4,669 |
| 77401 | Houston (Bellaire) | 63.0 | Silver | 4,628 |
| 78703 | Austin (Tarrytown) | 62.9 | Silver | 5,263 |
| 77027 | Houston (River Oaks area) | 62.8 | Silver | 4,073 |
| 78746 | Austin (Westlake) | 62.8 | Silver | 6,723 |
| 75225 | Dallas (University Park) | 62.5 | Silver | 5,963 |
| 77024 | Houston (Memorial) | 60.7 | Silver | 8,903 |
| 77056 | Houston (Galleria area) | 60.3 | Silver | 4,797 |
| 77046 | Houston (Highland Village) | 60.2 | Silver | 545 |
Market Opportunity Score blends 65+ population density (log-scaled), household wealth (income + home value), and 65+ population growth rate, each weighted and normalized against every ZCTA nationwide. Tiers (Platinum/Gold/Silver/Below Threshold) use fixed national thresholds, so a state's top score reflects how it compares to the whole country, not just itself.
Want this for your target market?
We can run this scoring model against any state or metro — ranked ZIP table, interactive map, and exportable report, ready in days.